January 2026
This note documents a small empirical study used to inform screening decisions.
The goal is not forecasting returns, but estimating short-horizon downside risk as a function of a simple trend/extension measure.
Question.
Conditional on a stock trading above its 200-day moving average, how does the probability of a future drawdown change as the stock becomes more extended above MA200?
Data and universe
The universe is the current S&P 500 constituents pulled from iShares IVV holdings.
Code reference (universe source):
url = (
    "https://www.ishares.com/us/products/239726/"
    "ishares-core-sp-500-etf/1467271812596.ajax"
    "?fileType=csv&fileName=IVV_holdings&dataType=fund"
)
df = pd.read_csv(url, skiprows=9)
tickers = [t.replace(".", "-") for t in df["Ticker"].dropna().unique().tolist()]Prices are downloaded from Yahoo Finance via yfinance using auto_adjust=True (adjusted prices).
Study window
- Start: 2015-01-01
- End: today (runtime date)
Definitions
Distance to MA200
For each ticker, the 200-day moving average is computed on adjusted close:
ma200 = close.rolling(200).mean()
dist_ma200 = (close - ma200) / ma200Interpretation:
dist_ma200 = 0→ price equals MA200dist_ma200 = 0.10→ price is 10% above MA200
The aggregation stage in this study keeps only observations with dist_ma200 ≥ 0, i.e. price above MA200.
data = data[data["dist_ma200"] >= 0]This isolates the regime in which the screening logic is intended to operate. The subsequent analysis therefore describes conditional downside risk within positive-trend environments, not across all market states.
Forward drawdown within a fixed horizon
The event of interest is a peak-to-trough drawdown from today’s close over the next HORIZON_DAYS trading days.
Operational definition:
- shift forward by one day (avoid using today’s close again)
- take the minimum close over the next horizon
- compute drawdown relative to today’s close
future_min = (
    close.shift(-1)
    .rolling(HORIZON_DAYS, min_periods=HORIZON_DAYS)
    .min()
)

dd_hd = (future_min - close) / closeWith:
DD_TARGET = -0.10HORIZON_DAYS = 14
We study the probability:
P(dd_hd ≤ −10% within 14 trading days)
This is a binary event per day per ticker: did the price drop by at least 10% within the next 14 days?
Processing and aggregation
Each ticker produces a small DataFrame of aligned observations:
out = pd.DataFrame({
    "dist_ma200": dist_ma200,
    "dd_hd": dd_hd
}).dropna()
All tickers are concatenated into one pooled dataset:
data = pd.concat(all_data, axis=0)Note on pooling.
This implicitly weights tickers by the number of available daily observations.
No attempt is made to equal-weight tickers or control for sector composition.
This is acceptable for a first-pass operational heuristic, but it is a limitation.
Binning and empirical risk estimate
Distance to MA200 is discretized into bins from 0% to 60% in steps of 5%.
bins = np.arange(0.0, 0.61, 0.05)
data["dist_bin"] = pd.cut(data["dist_ma200"], bins=bins)For each bin, we compute:
obs= number of daily observations in the binp_dd_10_14d= fraction of observations wheredd_hd <= -0.10
summary = (
    data.groupby("dist_bin")
    .apply(lambda x: pd.Series({
        "obs": len(x),
        p_col: (x["dd_hd"] <= DD_TARGET).mean()
    }))
    .dropna()
)This produces an empirical curve:
distance-to-MA200 → probability of a −10% drawdown within 14 days
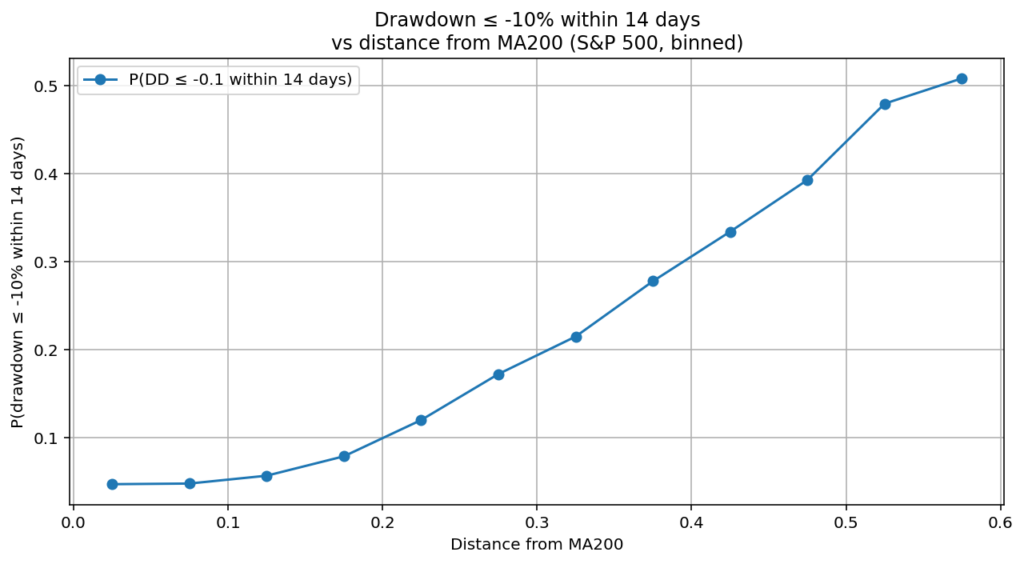
Probability of DD ≤ −10% within 14 trading days vs distance to MA200 (binned).
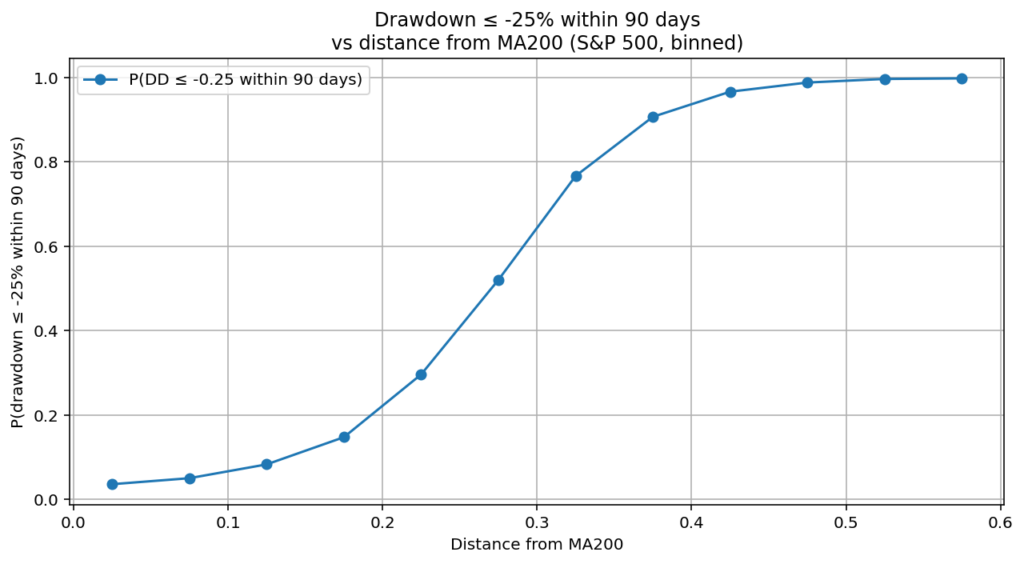
For reference, the same relationship is shown below for a larger drawdown magnitude (−25%) over a longer horizon (90 trading days). The curve remains monotonic, but its shape becomes much steeper and more convex (with clear saturation at high extensions), consistent with downside risk accumulating over longer horizons.
A heuristic “safety threshold”
The code defines a baseline risk using the 0–10% bin region:
base_bins=(0.0, 0.10)
base_risk = summary.loc[base_mask, p_col].mean()Then it scans bins in increasing order and returns the first bin whose risk is at least multiple × base_risk (default multiple = 2.0):
if row[p_col] >= multiple * base_risk:
    threshold = (interval.left + interval.right) / 2
return threshold, base_riskInterpretation:
- compute a “normal” short-horizon drawdown rate close to MA200
- identify the first MA extension level where risk approximately doubles
This is not a statistical test and does not claim a true structural breakpoint.
It is a pragmatic operational marker.
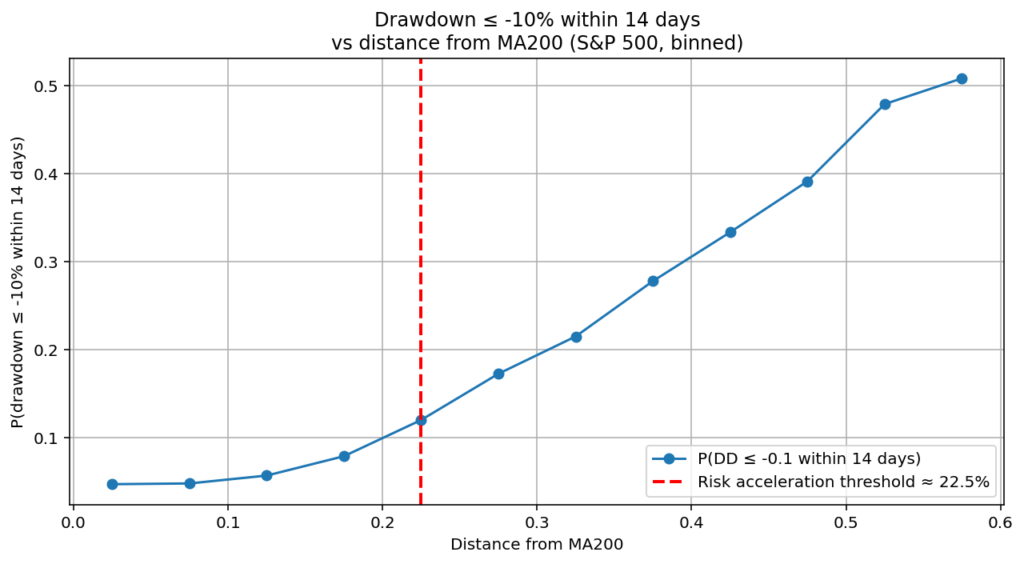
Same chart with the estimated threshold vertical line.
An alternative threshold based on risk acceleration
A second, complementary definition of the safety threshold focuses on changes in the shape of the risk curve, rather than on absolute risk levels.
Instead of comparing probabilities to a fixed multiple of a baseline, this approach computes the discrete first derivative of the binned risk curve with respect to distance from MA200:
summary["risk_slope"] = summary[p_col].diff()The threshold is then defined as the first distance bin where the increase in risk becomes unusually large, operationally identified as a high-quantile realization (e.g. the 75th percentile) of the risk slope.
Interpretation.
- measure how fast drawdown risk increases as MA200 distance grows
- identify the point where risk starts to accelerate, not merely where it becomes large
- interpret this location as a change in risk regime, rather than a level crossing
This definition does not rely on an arbitrarily chosen baseline region or multiplicative factor.
Instead, the threshold emerges from the local geometry of the empirical curve.
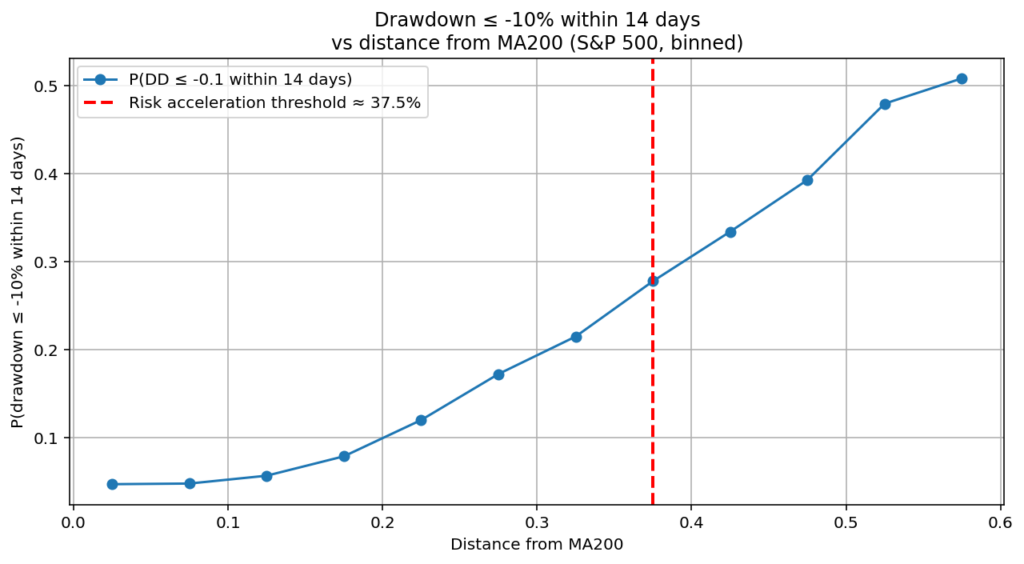
The vertical line highlights the distance level where drawdown risk begins to accelerate, based on changes in the slope of the empirical curve.
Comparing the two approaches
| Aspect | Heuristic ×2 threshold | Risk-acceleration threshold |
|---|---|---|
| Depends on absolute risk level | Yes | No |
| Depends on chosen baseline bins | Yes (0–10%) | No |
| Sensitive to DD target / horizon | Weakly | Strongly |
| Identifies level | Risk magnitude | Risk regime change |
| Numerical stability | Higher | Lower |
| Conceptual robustness | Lower | Higher |
The two thresholds answer different questions:
- the heuristic threshold asks “when does risk become meaningfully larger than normal?”
- the derivative-based threshold asks “when does risk start increasing faster than before?”
Both are operationally useful.
In this study, the derivative-based definition is preferred when the goal is to detect early signs of increasing fragility, rather than to enforce a fixed risk cap.
Limitations and failure modes
This study is simple by design and has obvious limitations:
- Survivorship / constituent drift
The IVV list is current constituents, while the price history extends back to 2015. - Pooling bias
Pooling daily observations across tickers overweight the most liquid/continuous histories. - Non-independence of observations
Daily points are highly autocorrelated; “obs” counts are not independent samples. - No conditioning on volatility regime
The probability of a −10% drawdown in 14 days is regime-dependent (macro volatility, sector risk). - No sector control
Extension above MA200 may correlate with sector cycles and factor exposure.
This note should therefore be treated as:
an operational heuristic to be validated and iterated, not a concluded result.
Implementation details (for reproducibility)
Key parameters:
START = "2015-01-01"
DD_TARGET = -0.10
HORIZON_DAYS = 14
MIN_HISTORY = 200
bins = np.arange(0.0, 0.61, 0.05)The study uses auto_adjust=True for consistency of historical prices.
Next iteration (planned)
If this heuristic proves useful operationally, the next step is to repeat the same analysis:
- conditional on market regime (Risk ON/OFF)
- equal-weighted per ticker (aggregate per ticker first, then average)
- with multiple horizons (5/10/21 days) and multiple drawdown targets (−5%/−10%/−15%)
- with confidence intervals (bootstrap by ticker, not by day)
Closing note
This work exists to support screening decisions with a simple empirical lens:
How much short-horizon downside risk am I implicitly accepting when a stock is far above MA200?
No claim is made that the threshold is universal or stable.
The only claim is that it is measurable, repeatable, and operationally relevant.

AIQ Notes
Independent Trader · AI-assisted Coding & Systematic Analysis
G. D. P.